 This MXIM historical earnings page last updated 9/20/2021
|
| Period | Historical Earnings Date | GAAP |
|---|
| Q4 2021 | 7/27/2021 | 0.72B |
| Q3 2021 | 4/27/2021 | 0.67B |
| Q2 2021 | 1/26/2021 | 0.63B |
| Q1 2021 | 10/27/2020 | 0.62B |
| Q4 2020 | 7/28/2020 | 0.55B |
| Q3 2020 | 4/28/2020 | 0.56B |
| Q2 2020 | 1/28/2020 | 0.55B |
| Q1 2020 | 10/29/2019 | 0.53B |
| Q4 2019 | 7/30/2019 | 0.56B |
| Q3 2019 | 4/30/2019 | 0.54B |
| Q2 2019 | 1/29/2019 | 576.91M |
| Q1 2019 | 10/30/2018 | 638.50M |
| Q4 2018 | 7/26/2018 | 633.15M |
| Q3 2018 | 4/26/2018 | 648.60M |
| Q2 2018 | 1/25/2018 | 622.64M |
| Q1 2018 | 10/19/2017 | 575.68M |
| Q4 2017 | 7/20/2017 | 602.00M |
| Q3 2017 | 4/20/2017 | 581.22M |
| Q2 2017 | 1/26/2017 | 551.00M |
| Q1 2017 | 10/20/2016 | 561.40M |
| Q4 2016 | 7/21/2016 | 566.13M |
| Q3 2016 | 4/21/2016 | 555.25M |
| Q2 2016 | 1/21/2016 | 510.83M |
| Q1 2016 | 10/22/2015 | 562.51M |
| Q4 2015 | 7/23/2015 | 582.52M |
| Q3 2015 | 4/23/2015 | 577.26M |
| Q2 2015 | 1/22/2015 | 566.81M |
| Q1 2015 | 10/23/2014 | 580.00M |
| Q4 2014 | 7/24/2014 | 642.50M |
| Q3 2014 | 4/24/2014 | 606.00M |
| Q2 2014 | 1/23/2014 | 620.00M |
| Q1 2014 | 10/24/2013 | 585.00M |
| Q4 2013 | 7/25/2013 | 608.00M |
| Q3 2013 | 4/25/2013 | 605.00M |
| Q2 2013 | 1/24/2013 | 605.00M |
| Q1 2013 | 10/25/2012 | 623.00M |
| Q4 2012 | 7/26/2012 | 605.00M |
| Q3 2012 | 4/26/2012 | 571.21M |
| Q2 2012 | 1/26/2012 | 591.36M |
| Q1 2012 | 10/20/2011 | 0.64B |
|

|
| Period | Historical Earnings Date | Adj. EPS |
|---|
| Q4 2021 | 7/27/2021 | 0.910 |
| Q3 2021 | 4/27/2021 | 0.810 |
| Q2 2021 | 1/26/2021 | 0.730 |
| Q1 2021 | 10/27/2020 | 0.720 |
| Q4 2020 | 7/28/2020 | 0.580 |
| Q3 2020 | 4/28/2020 | 0.610 |
| Q2 2020 | 1/28/2020 | 0.560 |
| Q1 2020 | 10/29/2019 | 0.520 |
| Q4 2019 | 7/30/2019 | 0.570 |
| Q3 2019 | 4/30/2019 | 0.520 |
| Q2 2019 | 1/29/2019 | 0.6 |
| Q1 2019 | 10/30/2018 | 0.75 |
| Q4 2018 | 7/26/2018 | 0.73 |
| Q3 2018 | 4/26/2018 | 0.73 |
| Q2 2018 | 1/25/2018 | 0.65 |
| Q1 2018 | 10/19/2017 | 0.6 |
| Q4 2017 | 7/20/2017 | 0.63 |
| Q3 2017 | 4/20/2017 | 0.56 |
| Q2 2017 | 1/26/2017 | 0.46 |
| Q1 2017 | 10/20/2016 | 0.48 |
| Q4 2016 | 7/21/2016 | 0.49 |
| Q3 2016 | 4/21/2016 | 0.41 |
| Q2 2016 | 1/21/2016 | 0.32 |
| Q1 2016 | 10/22/2015 | 0.42 |
| Q4 2015 | 7/23/2015 | 0.43 |
| Q3 2015 | 4/23/2015 | 0.4 |
| Q2 2015 | 1/22/2015 | 0.33 |
| Q1 2015 | 10/23/2014 | 0.38 |
| Q4 2014 | 7/24/2014 | 0.43 |
| Q3 2014 | 4/24/2014 | 0.43 |
| Q2 2014 | 1/23/2014 | 0.36 |
| Q1 2014 | 10/24/2013 | 0.41 |
| Q4 2013 | 7/25/2013 | 0.44 |
| Q3 2013 | 4/25/2013 | 0.45 |
| Q2 2013 | 1/24/2013 | 0.42 |
| Q1 2013 | 10/25/2012 | 0.47 |
| Q4 2012 | 7/26/2012 | 0.45 |
| Q3 2012 | 4/26/2012 | 0.18 |
| Q2 2012 | 1/26/2012 | 0.3 |
| Q1 2012 | 10/20/2011 | 0.460 |
|
|
Quotes delayed 20 minutes
|
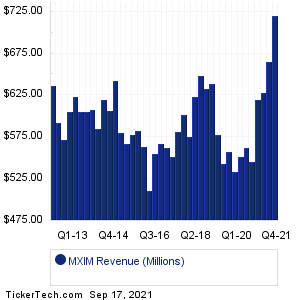
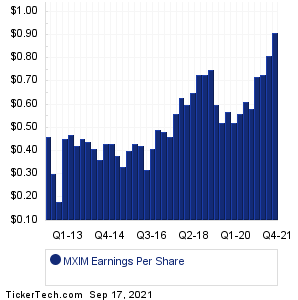
On this page we presented the MXIM historical earnings date information for Maxim Integrated Products. Reviewing that
MXIM Historical Earnings for the company, we see that the highest historical earnings result in our data set was in Q4 2021, when MXIM posted adjusted EPS of 0.910/share. Meanwhile the lowest MXIM historical earnings result was in Q3 2012, when MXIM posted adjusted EPS of 0.18/share. Moving to Maxim Integrated Productss historical revenue numbers, the largest revenue quarter in our data set was seen in Q4 2021 when MXIM reported 0.72B in revenue, while the smallest revenue quarter was Q2 2016 when MXIM reported 510.83M in revenue.
For self directed investors doing their due diligence on MXIM or any other given stock, their research can benefit from
looking into all of the Maxim Integrated Products historical earnings in our data set presented side by side
on one page for ease of comparison. Reviewing this historical EPS information can help when projecting future earnings per share,
as well as providing important context for pondering whether the historical earnings trajectory justifies the current stock value or not.
That's why we bring you HistoricalEarnings.com to make it more convenient for investors to look into
Maxim Integrated Products historical earnings, or the historical earnings information for any stock in our coverage universe.
In your continued due diligence investigations, we hope you check out the further links included for historical PE studies, earnings
surprises history as well as next earnings dates for MXIM. Thanks for visiting, and the next
time you need to research MXIM historical earnings or those of another stock, we hope our site will come to your mind
as your preferred historical earnings, revenue, and EPS research resource of choice.